Ranging from brief social posts to deep-dive digital guides, I’ve written thousands of pieces of content for SaaS companies, small businesses, government offices, major nonprofits, and my own websites.

These pieces of content were tracked and analyzed to gauge their success, but all using unique measuring sticks. How? Using a tailored content scoring process.

With your own tailored content scorecard, you can create a data-driven process for measuring your individual content marketing success. I’ve gathered examples from my own websites and brands across industries, plus tips to help you create a powerful content scoring system.
I even have a metric that one entrepreneur says can impact conversions by 50% — measured using a free tool. Excited? Let’s get scoring!
Table of Contents
- What is content scoring?
- Why is content scoring important?
- How to Score Content
- Content Scoring Best Practices
- Content Scoring Tools
- ChatGPT For Scoring
- What’s a good content score?
What is content scoring?
Content scoring is the process of measuring the success of your content marketing. Metrics such as views, engagement, shares, and backlinks are tracked to analyze content quality and performance.
The resulting scorecard helps steer future content creation.
Why is content scoring important?
Let’s zoom in on the three big benefits of content scoring, starting with the term every marketer loves to hate: single source of truth.
Content scoring helps create a single source of truth.
93% of marketers with a single source of truth for data report that it’s beneficial for their organization, but only 65% of marketers actually have one.
Lack of communication and alignment between departments is a top concern of marketers, per our 2024 State of Marketing survey. A scoring system unifies teams and facilities better communication, while also acting as a roadmap for populating your editorial calendar.
Pro tip: Both your sales and marketing teams must be involved in the creation of the scoring system to maximize its potential.
Content scoring helps you leverage expertise.
I‘m not an expert in social listening and TikTok content performance.
Guess what? I use Later to help me with that, which means I don’t need to be. The tools you use to score your content will leverage incredible amounts of expertise and put data-driven insights at your fingertips.
While you can use generic tools such as ChatGPT (and I’ll share a prompt in a minute), a huge benefit of the content scoring process is choosing specialized tools that deepen your understanding of your content.
Content scoring helps you prove ROI.
Return on investment is always a priority for marketing teams and organizations as a whole. But then, why does so much data fall through the cracks?
The numbers matter: Over half of marketing decisions are influenced by marketing analytics.
Yet data’s falling through the cracks. 87% of marketers reported that data was their company’s most underutilized asset.
Given that 50% of marketers plan on increasing their content marketing investment in 2025, marketing teams need to quantify content’s performance and prove ROI with as much detail as possible.
How to Score Content
Let‘s walk through the steps to score your content. After explaining each step, I’m going to show you how this looks using the example of a blog post from my website, Walk The Camino Portugués.
There‘s no one-size-fits-all solution when it comes to content scoring. It’s important for you to find a system that works, and you’ll — wait for it — actually use it (happily, I hope). Use this as your starting point.
Step 1: Choose which content you’ll score.
Not all content can be scored the same way. Social media content is different from email, which has different metrics from website content. Start this process by choosing which content you’re going to be scoring. Options include:
- Social media posts.
- Email marketing.
- Landing pages.
- Product pages.
- Blog posts.
- Videos.
As an example, I‘m going to be analyzing blog content for my travel site. Let’s look at which metrics belong on the scorecard.
Step 2: Choose your metrics.
You should consider key metrics related to content quality AND content performance. There are many numbers that you can choose from, and they don’t all need to be included on every scorecard (your marketing team will give you an ear full if you try).
Choose what matters most to your target audience and your business objectives. Here are some suggestions — notice that these include both positive and negative metrics (more on this in a minute).
- Video percentage watched.
- Reader satisfaction.
- Impressions/views.
- Optimization score.
- Follows/unfollows.
- Video view rate.
- Time on page.
- Conversions.
- Bounce rate.
- Scroll depth.
- Readability.
- Comments.
- Backlinks.
- Exit rate.
- Shares.
- Clicks.
- Saves.
What I’m measuring: The metrics that matter most to me with my new travel website are SEO score, website traffic, readability, and Pinterest saves. Given that this is a new website, I‘ll track SEO score and readability upfront and I’ll measure traffic and saves over a period of six months.
Step 3: Choose tools to score content.
The numbers you‘ll get from tools aren’t all the same. Some tools will score content by assigning an objective number, while others will gather analytical data.
For example, SurferSEO might assign a blog post an optimization score of 72. This number reflects how my content performed against platform or industry benchmarks. An engagement tool, on the other hand, may share that content’s engagement rate is up 5%.
The 72 and 5%, while both important, aren‘t directly comparable. It’s like comparing apples and oranges — keep this in mind as you parse your data.
Consider these tools to score your content:
- Google Search Console (GSC): search visibility.
- Google Analytics 4 (GA4): website traffic.
- Hemingway App: content readability.
- SurferSEO: website optimization.
- SharedCount: social shares.
- ChatGPT: content analysis.
- Later: social analytics.
- Semrush: readability.
It‘s worth noting that some insights won’t be discoverable using a content scoring method. Some extremely valuable insights can only be gathered through manual review of top-performing content and looking for trends. This is ideally done over a period with significant data, such as a year-end review.
My scorecard: I’ll be using GA4, SurferSEO, the Hemingway App, and SharedCount to create my content scoring model.
Step 4: Create a scorecard.
Once you‘ve established your scoring criteria, you need to store all of your scored content in one place for easy review. This can be done in a spreadsheet, Notion, within a tool’s analytics interface — I share options for this below.
For those who’d like to create their own scorecard for their unique scoring system, you can input data into a simple table.
Note: The numbers you‘ve collected all have different values. For example, a blog post’s SEO score of 78 isn’t directly comparable to getting 245 social shares.
Some marketers will resolve this by ranking all of their data points on a scale of 10, then adding these up at the end. I‘ll show you a screenshot of this type of table created with ChatGPT in a minute.
Personally, I’m choosing to just list the original numbers and evaluate them individually, as I think it dilutes the data too much to convert everything to a 1-10 scale.
I’ve done this below with my website data:
|
Article |
SEO Score |
Readability |
Search Ranking* |
Shares* |
|
Planning guide |
92 |
Grade 6 |
3 |
147 |
|
Scallop shell explained |
84 |
Grade 8 |
8 |
38 |
|
Luggage transfer |
98 |
Grade 7 |
6 |
12 |
*This is a new website, and there’s no data for these points yet, so these values are used as fillers.
Step 5: Use to inform content strategy.
Use the insights from your content scoring strategy to help you create high-quality content. When you have more than 12 months of data, you can look at seasonal trends and use these insights to guide the creation of your marketing calendar for the year (free template here).
As a content manager for businesses, these insights guide 80% of my content creation for the year.
Looking at my own scorecard, I know that I need to improve the readability of all of my pieces (see more on this in best practices). The data on rankings and traffic will prioritize which pieces need to be updated first.
Content Scoring Best Practices
Let’s look at some of the best practices for your content scoring process.
Find the silent data.
Jake Ward, founder of Kleo, suggests that you engage with your silent data in addition to the typical (loud) data points. Listening to the loud and silent data in your business can look like:
- Engagement + disengagement.
- Purchases + abandoned carts.
- Clicks + hovers.
“Don’t just focus on the obvious metrics like clicks or open rates, but also on the data that isn’t making noise,” Jake shared.
Choose metrics intentionally (new brand vs. established).
Key metrics for judging a new brand are sometimes different from those you’d use for an established brand. Established websites can see results for some key metrics much faster, like:
- Search rankings.
- Social shares.
- Backlinks.
A new website might need to wait months before it sees these numbers start to build momentum. As a result, I’d pay more attention to metrics, like:
- Time on page.
- Readability.
- Comments.
One of these metrics is much more important than most people (even marketers) realize — readability.
Don’t ignore readability.
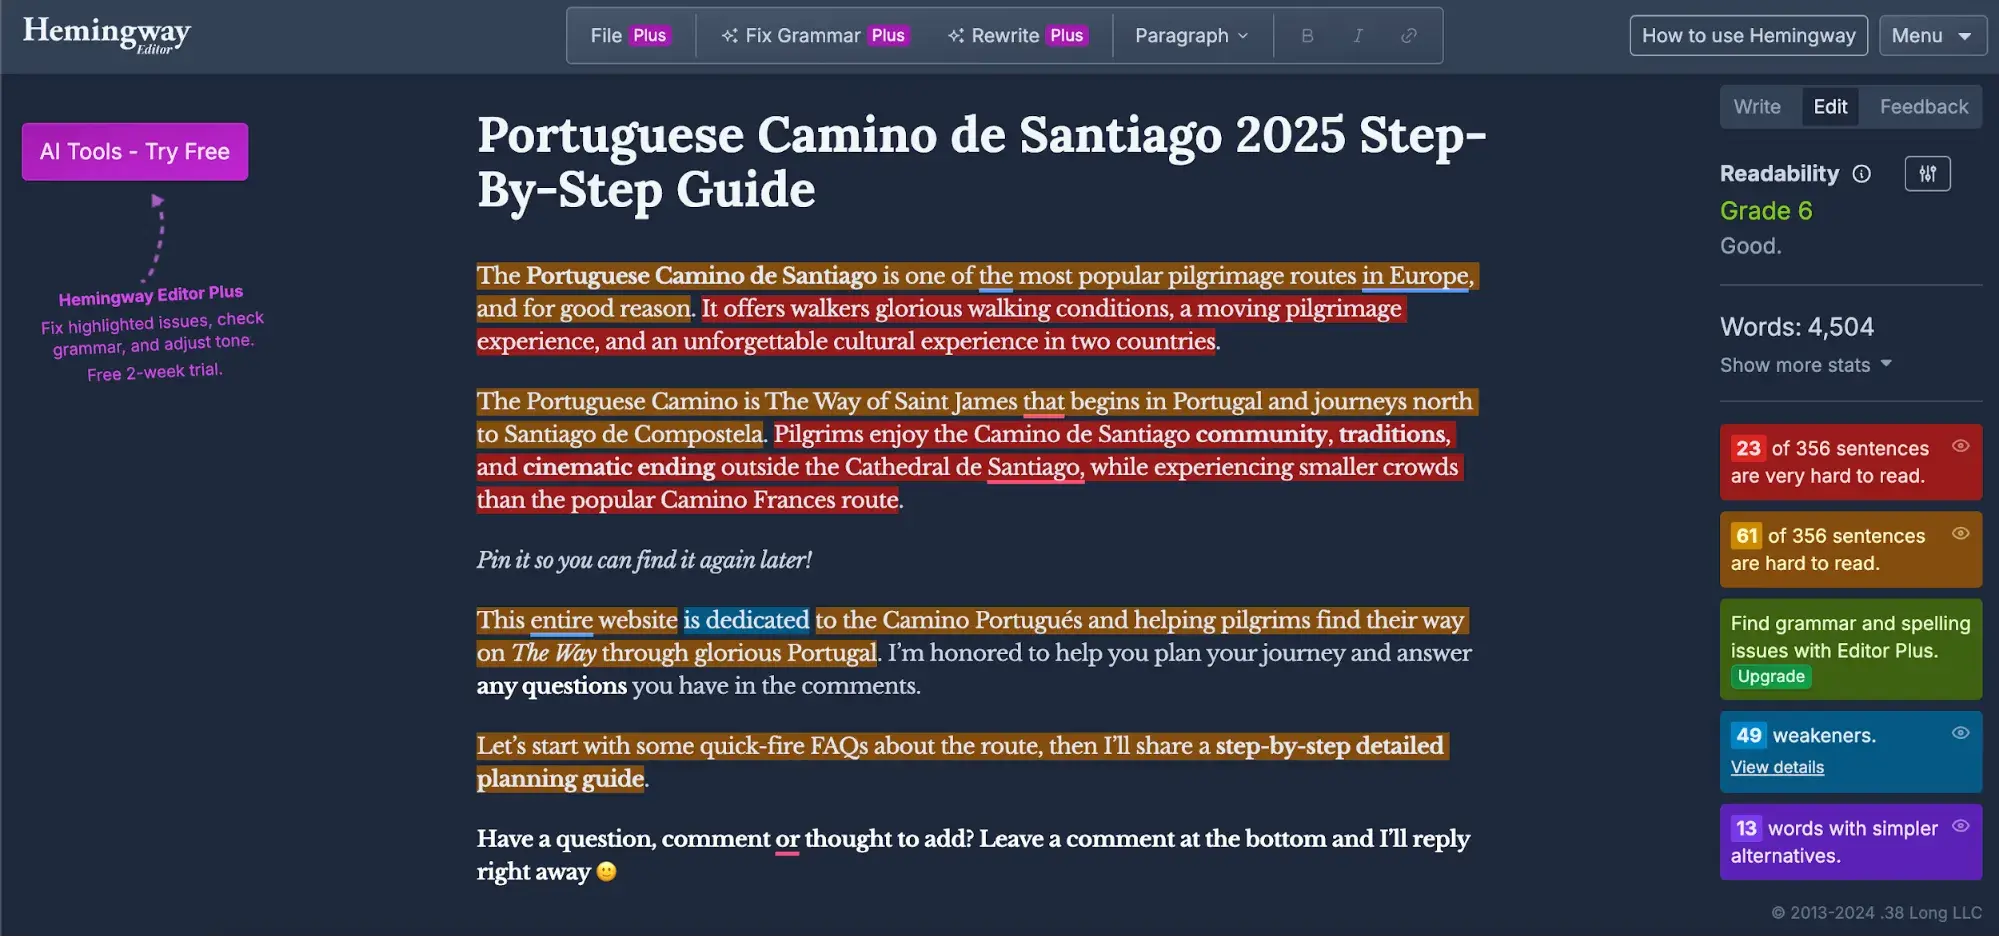
Alex Hormozi, founder of Acquisition, shared the power of improving readability in one of his “Mozi Money Minute” email blasts. He recommends simplifying your language to the third-grade level (age 8 or 9) using the Hemingway App.
“I once ran all my emails and web pages through this process and got a permanent 50% boost,” Hormozi shared with his email subscribers. “There are very few things that always work. But, this tactic is about as close as it gets.”
I‘d never used the Hemingway App before, and I thought my article’s content score would be fine. I was surprised to discover that my article was given a grade 6 readability score and would require edits to 84 sentences to maximize the readability per Hormozi’s advice.
Source
Leverage those positive metrics.
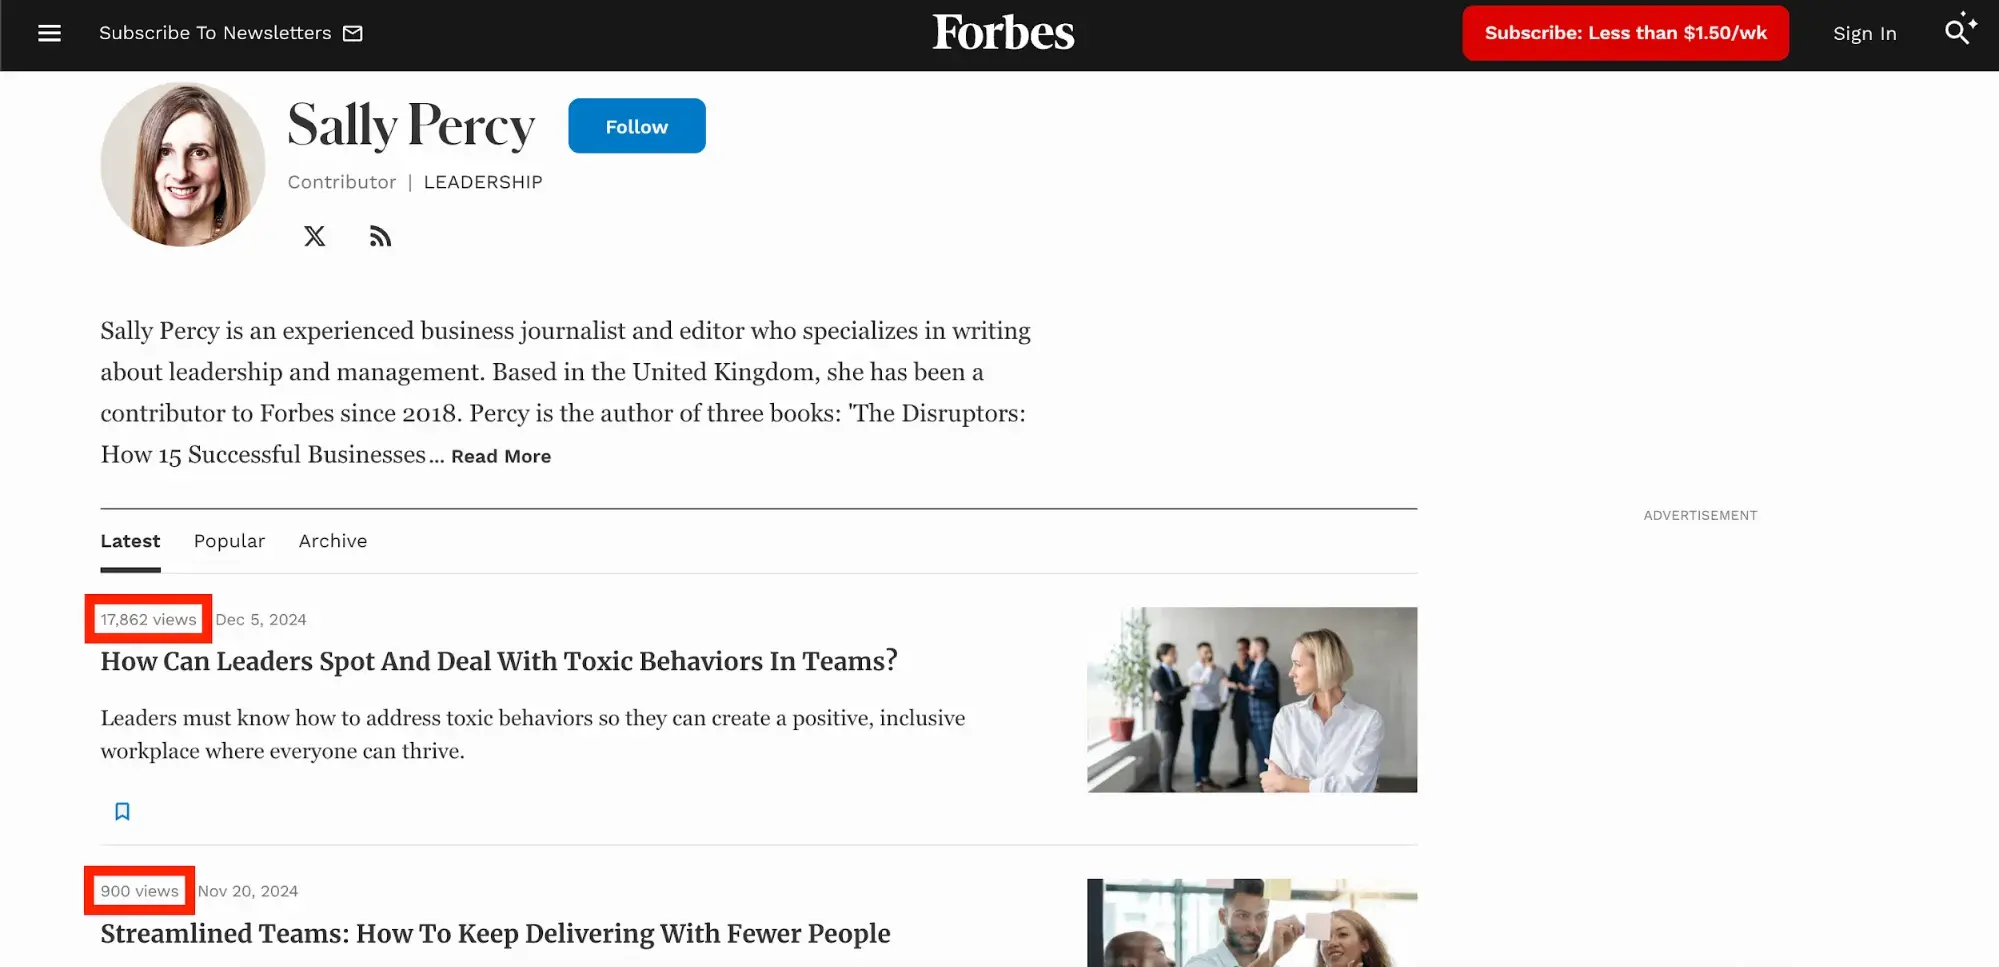
Having content that performs well should do more than just cause high-fives in the marketing department — it should also be leveraged as social proof. I spend a lot of time reviewing marketing materials online and I find that this is overlooked on 90% of websites.
Here’s an example of how Forbes leverages their positive metrics by publicly sharing article views:
Source
Why does it matter? Engagement begets more engagement. Tap into this self-fulfilling prophecy by displaying positive metrics on your website. Here are some ways to feature your positive metrics:
- Webpage backlinks: “As featured in” section
- Blog post views: Share total number of views (tutorial)
- Blog engagement: Display comment count
- Product downloads: Share the number of lifetime purchases or downloads
- Page shares: Display shared count (Social Warfare Pro plugin)
- Video views: Pin high-performing videos (TikTok tutorial, Instagram tutorial)
- Social followers: “Join X followers” website widget
I shared a lot of individual tools above, and I know that the number of options can be overwhelming for beginners. To help simplify it, I’m going to highlight a few powerful tools below that can solve most content scoring needs.
Important note: While I don’t spend time on them, Google Analytics 4 and Google Search Console are non-negotiable tracking tools that every website must have set up.
WordPress
Price: Free, with one paid tool featured below (Social Warfare Pro, $29 per year).
With a few standard plugins, WordPress users can customize their dashboard to include a number of important scoring metrics. This enables you to analyze your website content right within your site dashboard, without throwing a dozen more steps into your workflow.
Here, you can see five powerful metrics at a glance right within the “posts” page of my WordPress dashboard:

Source
Here’s a key for the boxed icons above:
- Stats: Jetpack (free).
- Comments: WordPress (free).
- Social shares: Social Warfare Pro (paid).
- Traffic light: SEO score by Yoast (free).
- Feather: Readability score by Yoast (free).
Your entire team will already have access to the website, which avoids extra costs of having to pay for “seats” on subscription-based platforms.
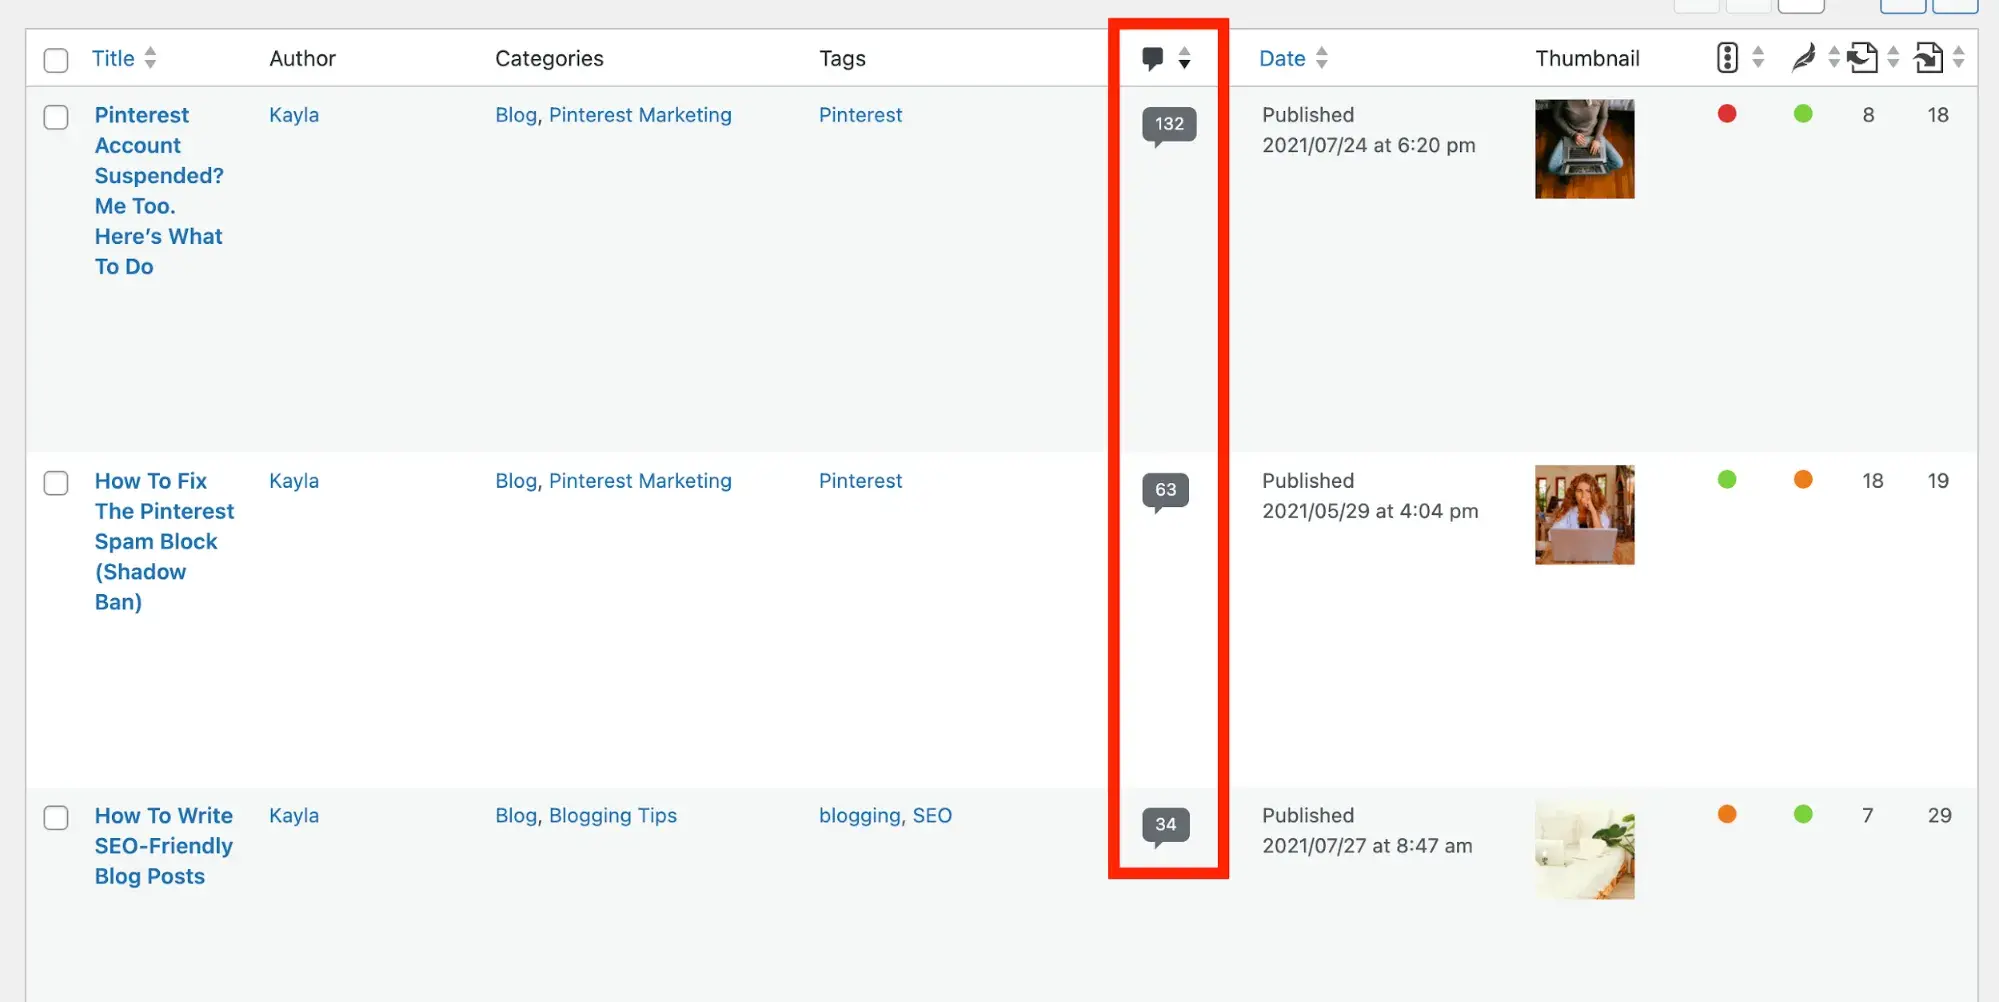
You can even sort content based on certain metrics, like shares or comments. You can see how that looks here on my main site, where I’ve sorted my blog posts in order of most comments to fewest comments:
Source
WordPress does have limitations, though. Data can’t be separated and analyzed by date, which can make finding specific relevant information difficult. Google Analytics is much more powerful for those advanced features but is overwhelming for beginners looking for at-a-glance data.
SEO Writing Assistant by Semrush
Price: Free plan, then $139.95 per month.
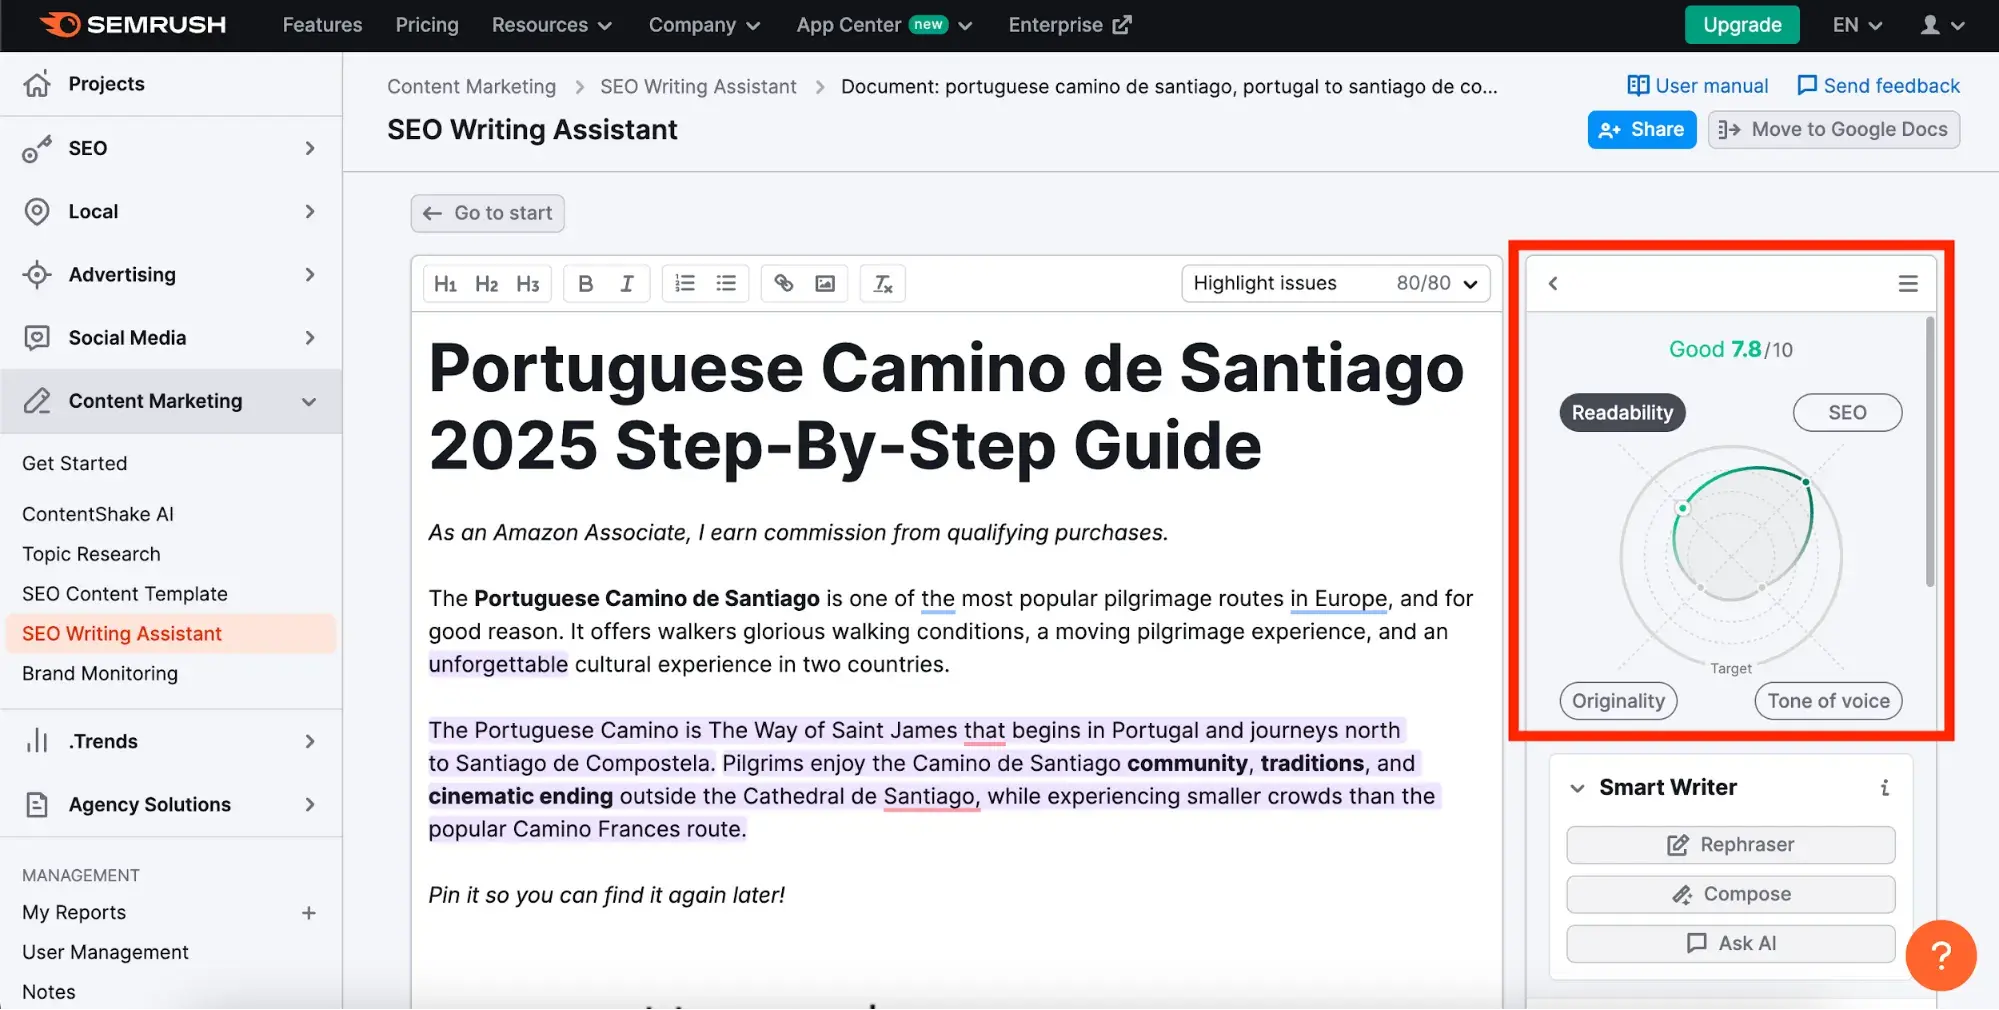
This is another tool that focuses on written website content, like articles, landing pages, product listings, etc. SEO Writing Assistant has a document-like interface where you can write content from scratch or paste in existing text. This tool has a scoring system that evaluates your content’s:
- Readability (free).
- SEO (free).
- Originality (paid).
- Tone of voice (paid).
Source
It gathers data for those four metrics and assigns a single score to your website content. This allows content assets to be easily compared and ranked.
I don‘t rely on this tool for my own content or my clients’ content, but I do think it‘s a great resource for people with straightward needs who aren’t brand loyal to other more specific tools.
Later
Price: Free plan, then $16.67 per month when billed annually.
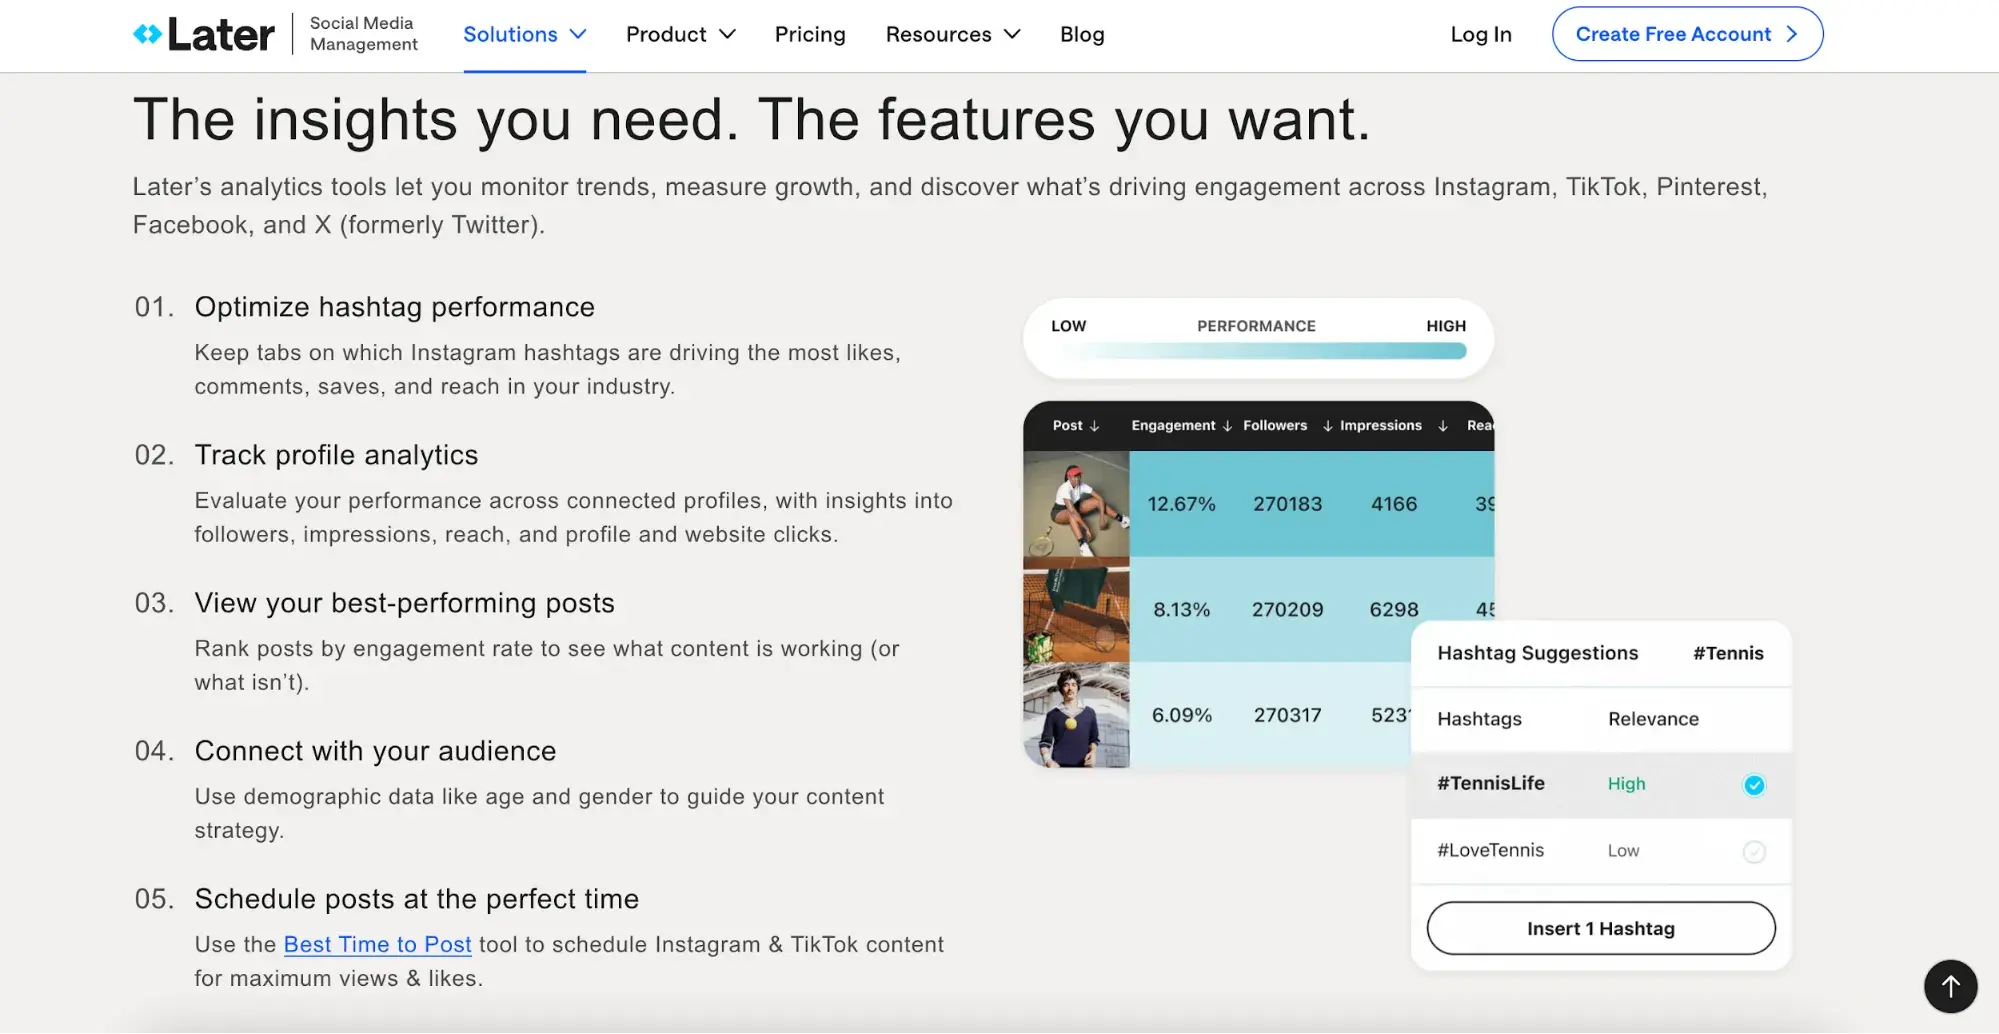
While the first two tools focused on owned content on your own website, Later analyzes social media content. This is an incredibly robust social scheduling platform that pulls huge amounts of data for you to sift through and analyze your content’s performance.
I‘ve been using Later for years, but I can’t share analytics screenshots without revealing private client information. Instead, here‘s a summary of the analytics capabilities as described on Later’s website:
Source
A few features I love:
- Content sorting based on whichever metric you value most.
- Finding your audience’s most active times online.
- Social listening.
I’ve worked on teams that use other scheduling tools — sometimes very pricey ones — but Later is my preferred platform. It has an enjoyable interface and puts a ton of analytics data at your fingertips (without being overwhelming).
ChatGPT For Scoring
Would I rely on ChatGPT for my entire content scoring process? No, I personally would choose tools that are specialized and store my data for me in a more convenient way.
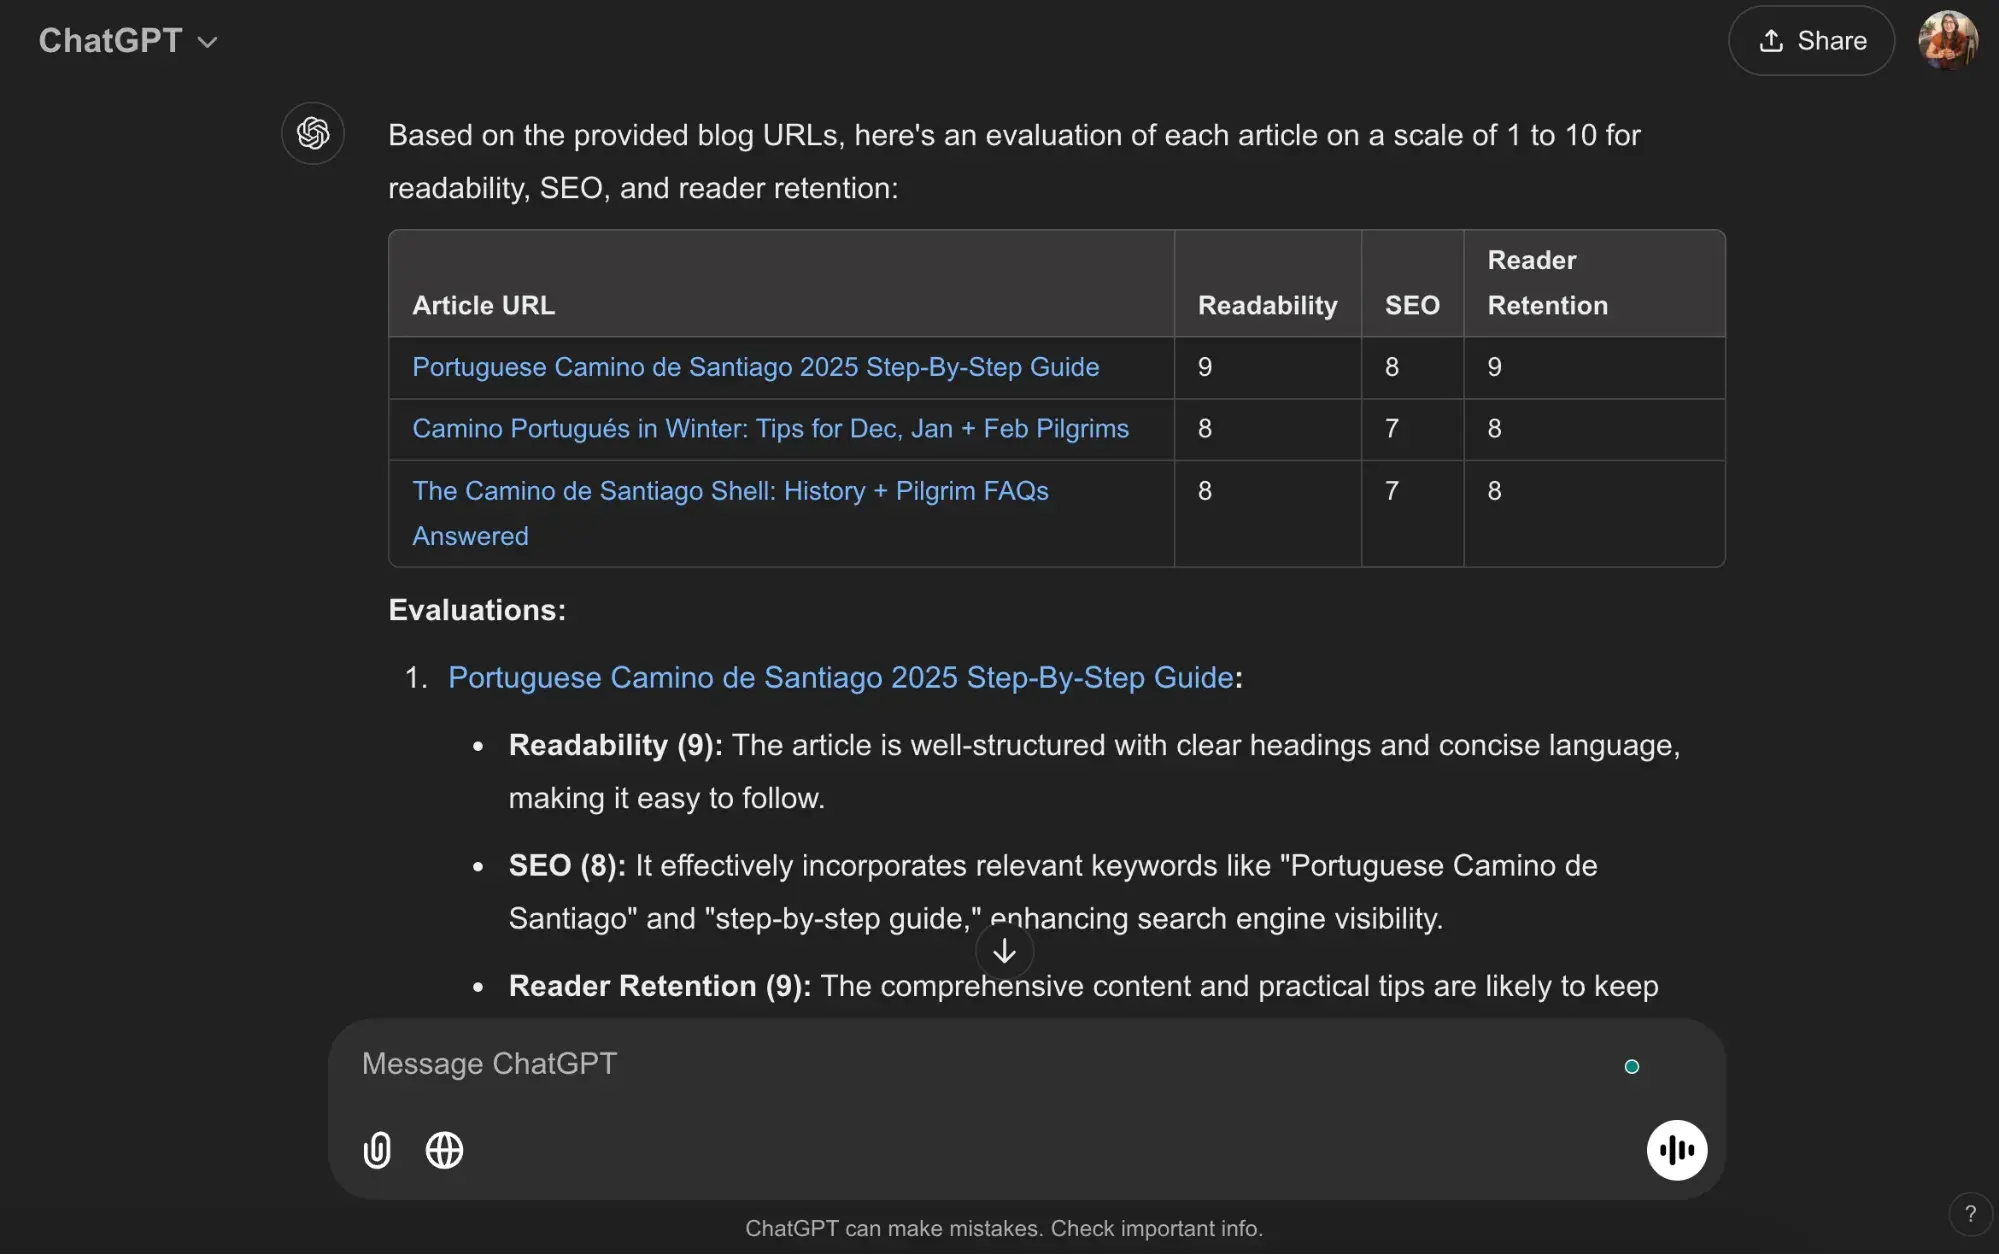
But maybe you‘ll find ChatGPT to be a fast and convenient way to evaluate your content. Note that ChatGPT can’t scrape content from social media, so it’s best used on your own website or XLS files.
Here’s a prompt for scoring website content:
You’re a content marketer trying to score the below [blog URLs/pages/product listings] based on readability, SEO, and ability to retain readers. Please generate a score on a scale of 1-10 for each of the above key metrics, then evaluate and score each piece of content below. Provide your data in a table.
Source
Scoring AI-generated content.
AI content can be valuable for your brand, but it needs to be leveraged carefully. Here are a few insightful statistics from our State of Marketing trends report:
- Only 6% of marketers report using AI to produce entire pieces of content for them.
- 95% of marketers who are using generative AI to write copy have to edit the text, with 44% saying they make significant edits.
- 60% of marketers fear the concern that AI can harm their brand’s reputation through plagiarism or bias.
When you’re ranking AI-generated content, assess it upfront for inaccuracies and plagiarism. When you’re gauging its performance, assess time spent on page, bounce rate, and conversion rate. Let content intelligence be your GPS.
If you’re going to choose AI tools, go for reputable tools that prioritize high-quality content, like the HubSpot AI Content Writer tool.
What’s a good content score?
There are mountains of data available on content performance. Need to know what the average X (previously Twitter) engagement rate for the finance sector is? Three percent. But, finding and leveraging that data for every single platform and industry would be tedious at best and impossible at worst.
Some software, like SEO Writing Assistant by Semrush, will use their own proprietary scoring system to combine several scoring factors into one number. No single software provides a complete picture, though.
How you’ll get the most value from content scoring: Identifying above or below-average content performance can only come from having month-over-month, year-over-year analytics and comparing your own datasets.
My Scoring Example
A good example is my Portuguese Camino luggage transfer guide. My article received a score of 6.9 out of 10 with Semrush’s tool, which earned it the label of “good.” However, when I looked at why it was given that score, I disagreed with it for a few reasons.
I chose to write a more in-depth guide. My article is 1,975 words long, while this tool is telling me to trim it back to 617 words. I’m a thorough writer, not a brief one (have you noticed?).
The tool also automatically assigned keyword targets from my article, many of which were incorrect. When I manually edited the keywords, my content’s score automatically went up to 7.7 out of 10.
Tools can be powerful, but keep prompting and tweaking them to personalize and tailor the results.
Final Thoughts
When I check on the content‘s performance, I’m excited. I’ll either discover cause for celebration or an opportunity to improve.
Speaking of improvement, I have my work cut out for me by simplifying my vocabulary and shortening my sentences to improve my readability score. I hope that these tools provide that same enthusiasm and direction for you (even if it means that you still have some work to do, like me).


![What Is Content Seeding & How Does It Work? Here’s the Expert Take [+ Examples] what-is-content-seeding-&-how-does-it-work?-here’s-the-expert-take-[+-examples]](https://blog.contentkrush.com/wp-content/uploads/2025/01/140837-what-is-content-seeding-how-does-it-work-heres-the-expert-take-examples-510x369.webp)


![12 Benefits of Content Marketing [+ Examples] 12-benefits-of-content-marketing-[+-examples]](https://blog.contentkrush.com/wp-content/uploads/2024/11/140591-12-benefits-of-content-marketing-examples-510x369.png)


![How to create an editorial calendar [+ free templates] how-to-create-an-editorial-calendar-[+-free-templates]](https://blog.contentkrush.com/wp-content/uploads/2025/07/141899-how-to-create-an-editorial-calendar-free-templates-510x369.webp)


Comment here