


The crown weighs heavily on the head of your marketing leadership when making command decisions about resource allocation. The SEO long game is important, but reserving a budget for search engine marketing (SEM) can also be a smart play, including pay-per-click (PPC) marketing.

Snagging higher spots on SERPs can quickly boost traffic, and PPC strategies have been proven to increase conversion. How can a marketer confidently decide how much money to put where, and is it time to convince the finance team to boost the budget?

Backing up your decisions or budgetary requests with data is a smart move. To that end, we’ve compiled a long and useful list of PPC — on both search and social — and SEM statistics that marketers can use in 2023 to guide and validate important strategic choices in their marketing plans.
Table of Contents
- Search PPC Statistics
- Social PPC Statistics
- Search Engine Marketing Statistics
- User Behavior Statistics
- Paid Search Statistics
Search PPC Statistics
- 90% of internet users see Google ads.
- 46% of web users can’t tell the difference between PPC ads and organic search links.
- Yet 77% of the respondents in a Clutch survey from 2019 said they’re confident they can recognize search ads among SERP results.
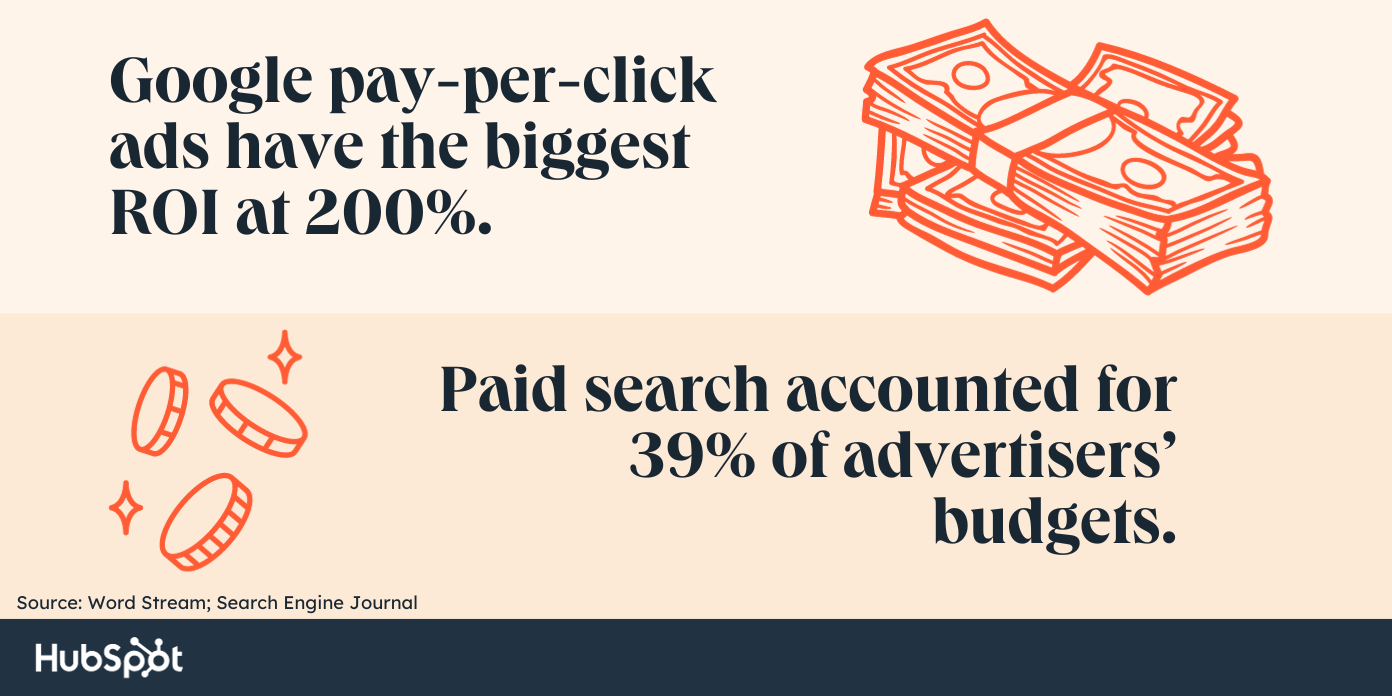
- Google pay-per-click ads have the biggest ROI at 200%.
- Small to mid-sized companies pay $9k-$10k/month for an average PPC campaign.
- 72% of companies haven’t looked at their ad campaigns in over a month.
- 47% of all global purchases take place online.
- Paid search accounted for 39% of advertisers’ budgets.
- 65% of clicks on commercial keywords are sponsored results, compared to 35% for organic results.
- Facebook Ads and Google Ads are the paid ad channels with the highest reported ROI.
- PPC generates double the number of website visitors that SEO brings in.
- The average click-through rate for Google Ads across all industries is 18%.
- The average cost-per-click across all industries is $3.53.
- 96% of Google’s revenue comes from Google Ads.
- 65% of small to mid-sized businesses run PPC campaigns.
- 45% of small businesses have a paid search strategy in place, and 55% of them use display ads.
- 94% of people skip over search ads.
- 40% of advertisers say their PPC budget is lower than they’d like.
- A mere 10% of advertisers optimize their Google Ads account weekly.
- 54% of people don’t feel culturally represented in online ads.
- Customers are up to 70% more likely to buy your product when you use retargeting.
- 52% of PPC clicks come from mobile.
- Bing’s average CPC is $1.54 — that’s 33% lower than what we see on Google Ads.
- Ads can boost brand awareness by 80%.
- 97% of people used the web to find local businesses in 2022.
- A personalized PPC landing page will be 5% more effective.
- People are four times more likely to click on a Google PPC ad than on any other platform.
- 84% of brands polled said they see good results with the PPC market.
- 70% of marketers still consider SEO to be more effective than PPC.
- Algorithm updates don’t affect your PPC like they do SEO.
- With Google Ads, businesses earn, on average, $8 for every $1.60 spent.
- Consumers spend 10% more money in a store if they have clicked on the retailer’s Google search ad before visiting.
Social PPC Statistics
- Globally, 4.74 billion people use social media.
- Last year, in 2022, the pool of social media users grew 4.2%.
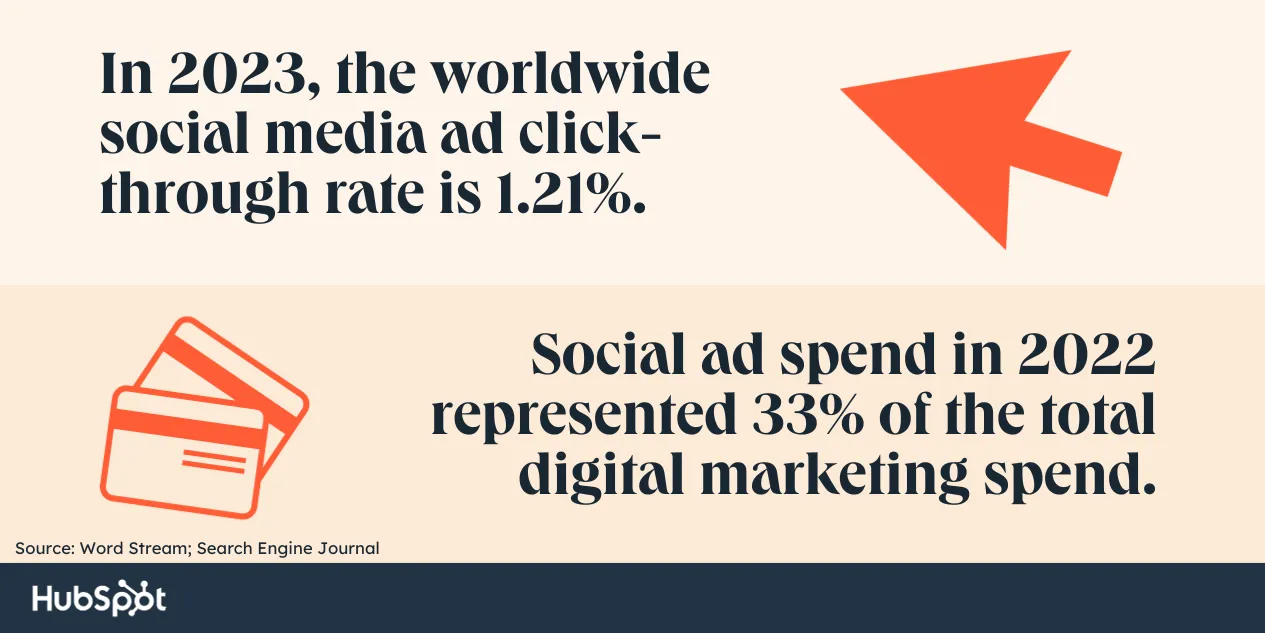
- Social ad spend in 2022 represented 33% of the total digital marketing spend.
- Over the course of 2022, the volume of social media ad impressions jumped by over 30%.
- Worldwide, the social media ad click-through rate (CTR) is 1.21%, but one year prior, it was higher — at 1.3%.
- Social media’s video ad spend at the end of 2022 was $24.35 billion — an increase of 20.1% over a one-year period.
- The largest social ad market in the world? The United States.
- Social media ad revenue is expected to balloon up to $385 billion by the year 2027.
- In Q3 of 2022, the cost-per-mille (CPM) for advertising on social media was $8.15, meaning advertisers had to pay that much to have their ads viewed by a thousand potential leads.
- According to a Hootsuite survey, 83% of marketers surveyed reported some measure of confidence in the ROI of social media, a 15% increase over the year before.
- 18 to 24-year-olds have 75% of the attention span of their elders — the 65+ demographic — when it comes to watching Facebook ad videos.
- The average Facebook user clicks on 12 Facebook ads every month.
- 9.21% of Facebook ads convert, which makes it the highest-converting platform available.
- Approximately 928.5 million people are reached by Instagram ads.
- 49% of internet users report being likely to purchase from brands they see ads for on social media.
- Snapchat ads are 7X more efficient at reaching Gen Z than TV ads.
Search Engine Marketing Statistics
- Around 93% of all virtual experiences, online interactions, and journeys begin with a search engine.
- Search marketing is 100 times more cost-efficient than other marketing strategies.
- SEM is the preferred choice of small businesses for online advertising — 45% of them invest in it.
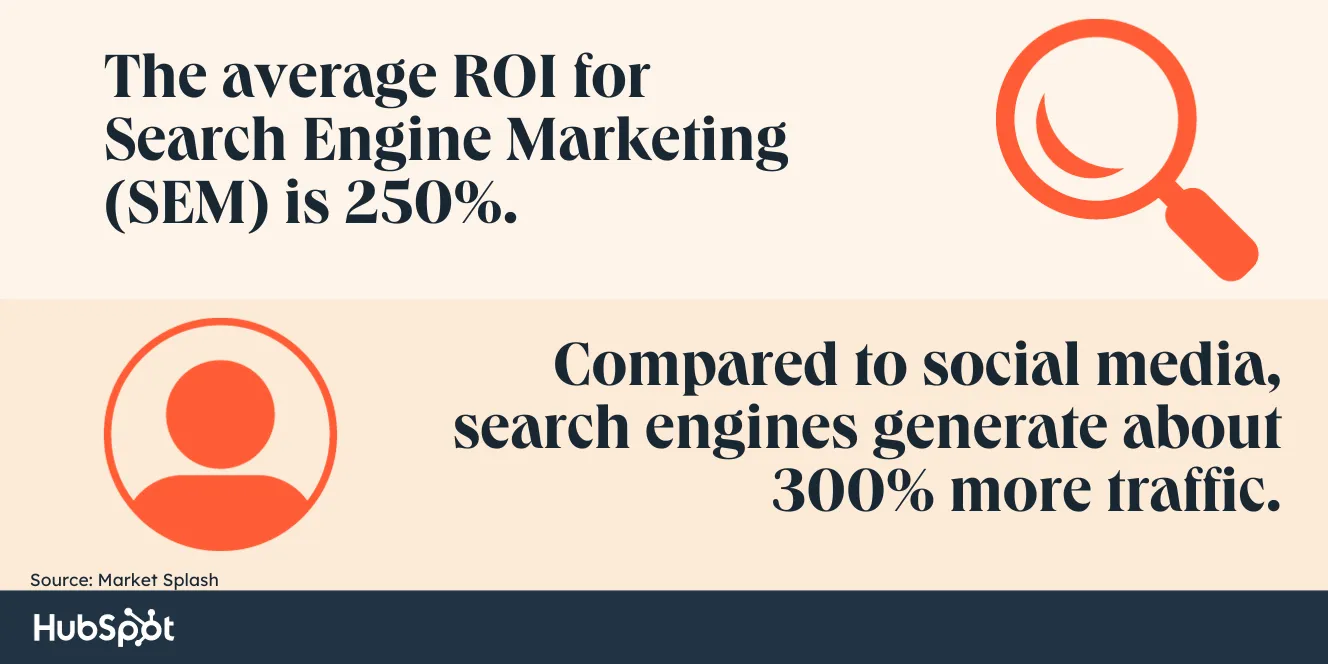
- The average ROI for Search Engine Marketing (SEM) is 250%.
- Compared to social media, search engines generate approximately 300% more traffic to websites.
- About 40% of users abandon a website that takes 3+ seconds to load.
- A 1-second delay in page response time can result in a 7% decrease in conversions.
- Google processes over 8.5 billion searches every day.
- Google makes up 78% of all online search behavior.
- Zero-click searches on Google have been increasing: 25.6% of desktop and 17.3% of mobile searches end without a click to another Google property.
- 95.88% of Google searches are four words or more.
- Google handles a stunning 3.1 trillion searches each year.
- Google’s top 5 organic listings attract approximately 67.6% of all clicks.
- Around 15% of questions asked on Google have never been asked before.
- Baidu is the Google of China and holds 75.54% of the search market share.
- Reviews say Bing has better image search capabilities than Google.
- Google handles a stunning 3.1 trillion searches each year.
- Bing is the #2 search engine and gets over 1.2 billion visits every month.
User Behavior Statistics
- Before making a purchase, 88% of consumers do some kind of online research.
- About 50% of users are more inclined to click on a brand result if that brand appears multiple times in the SERP.
- Mobile search query terms “best” and “right now” have increased by 125% over the past two years.
- 43.2% of internet users 16 to 64 cite one of their primary reasons for using the internet is to research products and brands.
- 58% of internet users purchase products and services online on a weekly basis.
- In terms of search, mobile is ahead with 59% of searches. Desktop has fallen to 39%.
- 93% of consumers say online reviews influence their purchase decisions.
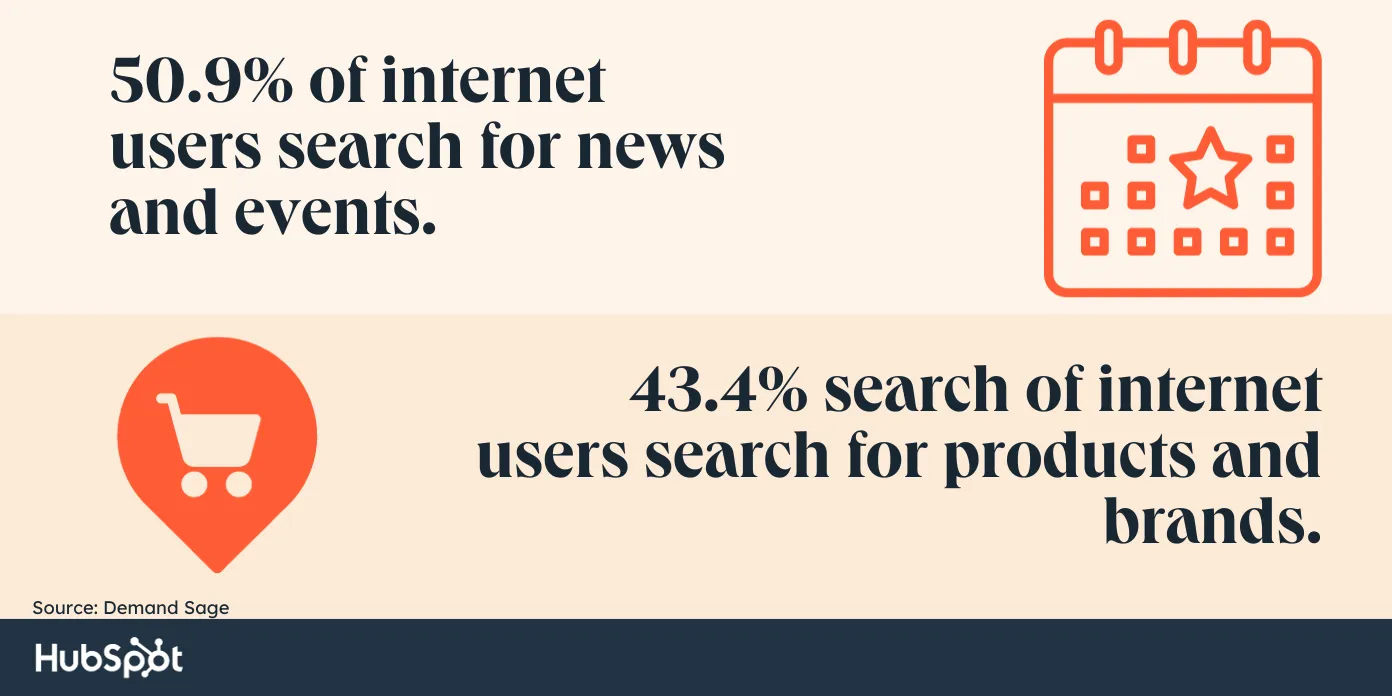
- 50.9% of internet users search for news and events — 43.4% search for products and brands.
- In the past two years, “Near Me” and “Where to buy” searches have doubled.
- Internet users are increasing by around 3.5% each year.
- Internet usage increased by 1355% from the beginning of 2000.
- China has the most internet users — 1050 million vs. the US at 311.3 million with India between them at 692 million.
- By 2025, it’s projected that about 73% of internet users will access it primarily through mobile devices.
- About 75% of search users never go beyond the first page of results.
Paid Search Statistics
- Organic and paid search make up 80% of all trackable website visits. The current split is 53% organic and 27% paid.
- 19% of marketers say paid search is their most profitable channel.
- B2B gets 12.3% of its traffic from paid search.
- Retail and ecommerce get 23.6% of their traffic from paid search.
- The highest-paid search CPC is in the legal industry and averages $6.75.
- The lowest CPC, $1.16, is in ecommerce.
- The highest paid ad conversion rate is in the dating and personals industry — 9.64%.
- The industry with the lowest paid ad conversion rate is, sadly, advocacy at 1.96%.
- The computer and electronics industry has the highest cost per conversion at $101.40.
- 74% of brands say that PPC ads are a huge driver for their business.
- Leads from search engines have a 14.6% close rate compared to outbound leads, which lag behind at a 1.7% close rate.


Comment here